

Buying Habits: Here’s How To Make Sense Of Your Customer Data

Even if you don’t sell vast volumes of products each day, your company will still deal with a lot of data. You’ll have details on what people buy, when they buy it and how often they spend money with you. The trouble with some firms is they seldom do anything with that data.
They assume there’s no value to it. But they’re wrong. To survive in today’s tough economy, one must evolve with the times. For a business to do that, they need to know more about their market. One way to get the answers they need is to use their own data.

Why not use general market data, I hear you cry? The answer is simple: your data is more reliable. You will know what people buy and what interests them. Third-party data cannot always get verified. So, how can you make sense of your customer data? And what can or should you do with it all? Keep reading to find out more!
Dump That Data!
The first thing you need to do is turn that information you’ve got into a usable format. How can you achieve that? If you run an e-commerce site, for example, you should be able to produce sales reports. If you can’t, it’s possible to do a raw SQL database dump.
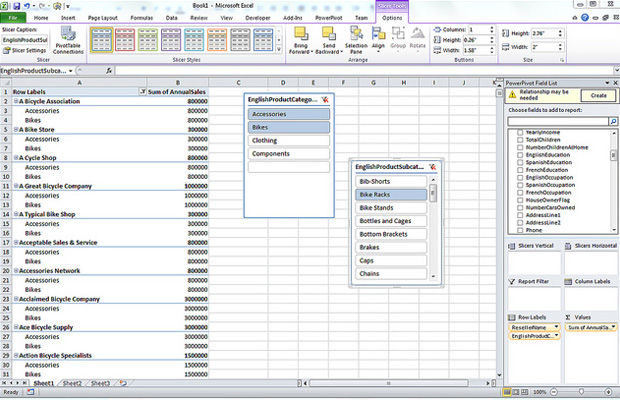
Once you’ve got that data, you need to put it into a format that makes it easy to work with. My weapon of choice for such tasks is Microsoft Excel. It’s cheap to buy, easy to use and everyone uses it on their computers. Why use anything else?
Not too familiar with the software? Don’t worry – it’s easy to learn. If you’ve never used it before, I can recommend MS Excel training by Training Connection. Otherwise, consider alternatives like lynda.com or even YouTube!
Trim The Fat
Next, you need to get rid of details that are pointless to the exercise. If you’ve done a raw database dump, you’ll have columns like “ID” in there. Get rid of that excess data – you don’t need it. All you need is access to the facts.
I’m talking about things like products and purchase dates and times. You need to think about what kind of information you’d like to know. For example, do you want to track trends for a particular product or time of year?
Do Some Data Cleansing
The next stage is to “clean” your data of any anomalies. I’m talking about things like duplicate entries or obvious errors. After all; the last thing you want to do is report on something that is factually incorrect!
If you’ve got a lot of data to clean, it might be worth roping in some help with the task.
Make Your Data Presentable
Last, but not least, it’s time to turn that data into something pretty! Excel offers all kinds of reporting possibilities. All you have to do is choose one that works for you.

Another option is to provide the summary data to a graphic designer. They can then turn that information into an amazing infographic!

You may also like...


![]() © 2024
© 2024
0 comments